Homes Sold Faster Than Ever in April; Prices Marched Upward:

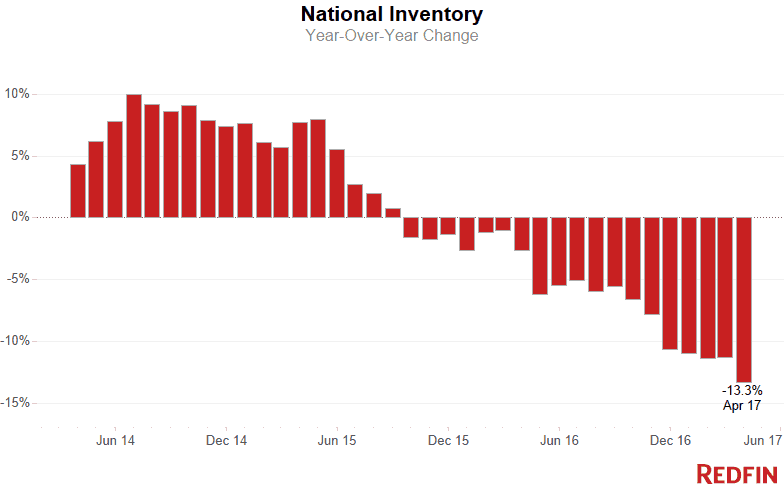
The median home sale price increased 6.2 percent in April to $280,000, continuing a five-year trend of steady annual growth. A lack of homes for sale kept a lid on sales, which inched up just 1.2 percent compared to last year. The number of homes for sale fell 13.3 percent, the steepest decline in four years. Since October 2015, the supply of homes for sale has declined every month. The number of homes newly listed for sale in April fell 8.8 percent compared to a year ago. Just over three months of supply remained, compared to the six months that represents a market balanced between buyers and sellers.
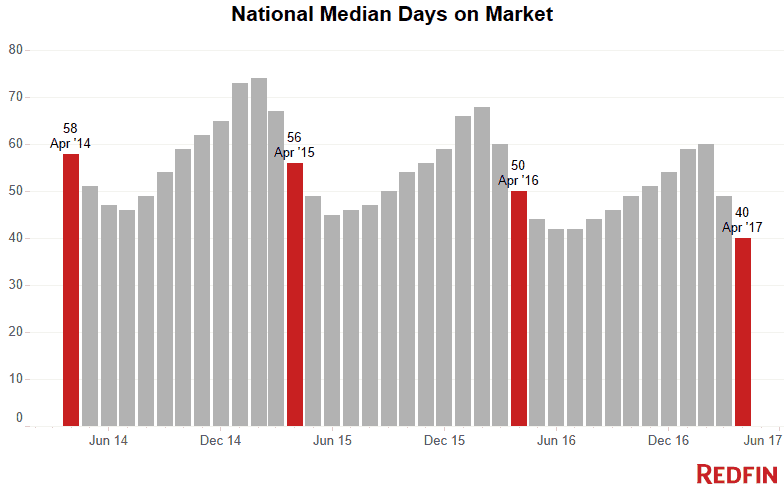
The typical home went under contract in 40 days, 10 days faster than a year earlier, making April the fastest month on record since Redfin began tracking the market in 2010. One in four (24.7%) homes sold above their list price, which is the highest percentage Redfin has recorded. One in five (22.2%) homes that sold in April went under contract within two weeks of their debut.
| Market Summary | April 2017 | Month-Over-Month | Year-Over-Year |
|---|---|---|---|
| Median sale price | $280,200 | 2.8% | 6.2% |
| Homes sold | 239,800 | -1.6% | 1.2% |
| New listings | 327,800 | -6.0% | -8.8% |
| All Homes for sale | 734,800 | 1.7% | -13.3% |
| Median days on market | 40 | -9 | -10 |
| Months of supply | 3.1 | 0.1 | -0.5 |
| Sold above list | 24.7% | 2.7% | 2.3% |
| Average Sale-to-list | 95.0% | 0.4% | 0.4% |
“When it comes to the housing market breaking records, I’m beginning to sound like a broken record,” said Nela Richardson, Redfin chief economist. “The market tends to accelerate through June so I wouldn’t be surprised if new records for speed and competition are reached in May and June given what we are seeing now. The only record this market can’t break is sales. You need more inventory for that!”
Denver was the fastest-moving market for the second month in a row, with the typical home finding a buyer in just six days. The metro area had a 1.1-month supply of homes for sale, and nearly half (47.1%) of homes there sold for more than their list price in April.
Seattle was the second-fastest market in April, with the typical home going under contract after seven days on the market. The number of homes for sale in Seattle fell by more than a third in April, the 32nd straight month of year-over-year declines. Less than a month’s supply remained, the lowest in the nation, and 62.1 percent of homes sold for more than their list price.
Austin, Nashville and Houston bucked the declining inventory trend, respectively adding 12.4 percent, 6.3 percent and 4.1 percent to housing supply from last year. However, competition remained strong— in Austin and Nashville 27 percent of homes sold above asking price, in Houston 15 percent of homes sold above asking price.
Other April Highlights
Competition
- Denver, CO was the fastest market, with nearly half of all homes going under contract in just 6 days, down from 11 days a year earlier. Seattle, WA was the next fastest market with 7 median days on market, followed by Portland, OR and Tacoma, WA at 10 days.
- The most competitive market in April was San Jose, CA where 75.4% of homes sold above list price, followed by 69.5% in San Francisco, CA, 69.4% in Oakland, CA, 62.1% in Seattle, WA, and 52.4% in Tacoma, WA.
Prices
- Milwaukee, WI had the nation’s highest price growth, rising 18.2% since last year to $208,000. Greenville, SC had the second highest price growth at 17.6% year-over-year, followed by Seattle, WA (17.4%), Deltona, FL (14.8%), and Tampa, FL (13.8%).
- 2 metros saw price declines in April: Baton Rouge, LA (-1.2%) and Greensboro, NC (-1%).
Sales
- 18 out of 90 metros saw sales surge by double digits from last year. Poughkeepsie, NY led the nation in year-over-year sales growth, up 36%, followed by Baltimore, MD, up 31%. Camden, NJ rounded out the top three with sales up 28% from a year ago.
- Home sales in Buffalo, NY and Ogden, UT declined by 19.4% and 19.3%, respectively.
Inventory
- Rochester, NY had the largest decrease in overall inventory, falling 37.8% since last April. Seattle, WA (-35.3%), Buffalo, NY (-32.8%), and Rochester, NH (-30.8%) also saw far fewer homes available on the market than a year ago.
- Fort Myers, FL had the highest increase in the number of homes for sale, up 29.2% year over year, followed by Knoxville, TN (19.7%) and Austin, TX (12.4%).
Below are market-by-market breakdowns for prices, inventory, new listings and sales for markets with populations of 1.5 million or more. For downloadable data on all of the markets Redfin tracks, visit the Redfin Data Center.
Median Sale Price
| Redfin Metro | Median Sale Price | Month-Over-Month | Year-Over-Year |
|---|---|---|---|
| Atlanta, GA | $216,100 | 1.5% | 8.1% |
| Austin, TX | $303,700 | 2.9% | 5.1% |
| Baltimore, MD | $255,500 | 6.9% | 5.1% |
| Boston, MA | $380,000 | 3.1% | 5.6% |
| Charlotte, NC | $230,500 | 2.4% | 12.4% |
| Chicago, IL | $238,000 | 5.8% | 5.8% |
| Cincinnati, OH | $165,500 | 3.4% | 10.3% |
| Cleveland, OH | $135,000 | 8.0% | 5.9% |
| Columbus, OH | $184,000 | 5.2% | 11.5% |
| Dallas-Fort Worth, TX | $257,000 | 2.8% | 13.2% |
| Denver, CO | $379,000 | 2.4% | 10.5% |
| Detroit, MI | $164,400 | 6.7% | 10.3% |
| Edison, NJ | $282,500 | 4.1% | 4.6% |
| Fort Lauderdale, FL | $229,000 | 0.4% | 8.5% |
| Hampton Roads, VA | $219,000 | 4.3% | 3.1% |
| Houston, TX | $227,000 | 0.4% | 4.6% |
| Indianapolis, IN | $164,500 | 2.9% | 8.2% |
| Kansas City, MO | $185,000 | 2.8% | 0.1% |
| Las Vegas, NV | $230,000 | 1.9% | 12.2% |
| Long Island, NY | $404,500 | 2.4% | 6.4% |
| Los Angeles, CA | $560,000 | 1.1% | 5.7% |
| Miami, FL | $279,000 | 3.3% | 11.6% |
| Milwaukee, WI | $208,000 | 9.5% | 18.2% |
| Minneapolis-St. Paul, MN | $245,000 | 4.6% | 7.0% |
| Nashville, TN | $262,900 | -0.8% | 7.7% |
| Oakland, CA | $683,000 | 5.1% | 9.3% |
| Orange County, CA | $660,000 | 1.5% | 5.0% |
| Orlando, FL | $220,000 | 0.9% | 12.8% |
| Philadelphia, PA | $235,000 | 6.8% | 6.8% |
| Phoenix, AZ | $235,000 | 0.4% | 4.4% |
| Pittsburgh, PA | $149,000 | 6.5% | 2.8% |
| Portland, OR | $365,000 | 2.0% | 9.0% |
| Riverside-San Bernardino, CA | $335,000 | 1.1% | 6.3% |
| Sacramento, CA | $355,500 | 3.0% | 5.8% |
| San Antonio, TX | $209,900 | 7.1% | 6.0% |
| San Diego, CA | $530,000 | 1.9% | 6.9% |
| San Francisco, CA | $1,250,000 | 6.6% | 3.7% |
| San Jose, CA | $960,000 | 0.5% | 4.9% |
| Seattle, WA | $505,000 | 5.2% | 17.4% |
| St. Louis, MO | $167,000 | 3.4% | 4.4% |
| Tampa, FL | $203,500 | 2.3% | 13.8% |
| Washington, DC | $392,000 | 6.9% | 4.5% |
| National | $280,200 | 2.8% | 6.2% |
Homes Sold
| Redfin Metro | Homes Sold | Month-Over-Month | Year-Over-Year |
|---|---|---|---|
| Atlanta, GA | 9,518 | -8.1% | 4.5% |
| Austin, TX | 2,600 | -1.6% | -3.6% |
| Baltimore, MD | 4,035 | 4.8% | 30.7% |
| Boston, MA | 4,371 | -2.9% | -9.2% |
| Charlotte, NC | 2,763 | -8.1% | -5.0% |
| Chicago, IL | 11,348 | 18.5% | 16.5% |
| Cincinnati, OH | 2,019 | -5.6% | -8.8% |
| Cleveland, OH | 2,115 | -4.6% | -11.4% |
| Columbus, OH | 2,409 | -0.9% | 5.2% |
| Dallas-Fort Worth, TX | 7,559 | -5.9% | -8.0% |
| Denver, CO | 4,899 | 7.8% | 11.1% |
| Detroit, MI | 5,096 | -10.7% | 8.1% |
| Edison, NJ | 2,585 | 0.7% | 18.1% |
| Fort Lauderdale, FL | 3,088 | -6.3% | -5.9% |
| Hampton Roads, VA | 2,033 | 4.5% | 11.6% |
| Houston, TX | 6,792 | -6.3% | 0.6% |
| Indianapolis, IN | 2,689 | -2.8% | -1.9% |
| Kansas City, MO | 2,817 | -1.6% | -5.7% |
| Las Vegas, NV | 3,509 | -10.4% | -0.6% |
| Long Island, NY | 1,910 | -20.2% | -1.3% |
| Los Angeles, CA | 5,895 | -11.0% | -8.7% |
| Miami, FL | 2,729 | 2.8% | 1.5% |
| Milwaukee, WI | 1,655 | 11.1% | -2.2% |
| Minneapolis-St. Paul, MN | 5,655 | 26.4% | 24.0% |
| Nashville, TN | 2,870 | -2.8% | -9.5% |
| Oakland, CA | 2,219 | -2.8% | -8.0% |
| Orange County, CA | 2,679 | -5.5% | -3.6% |
| Orlando, FL | 4,356 | 6.0% | 18.5% |
| Philadelphia, PA | 4,468 | 14.1% | 23.0% |
| Phoenix, AZ | 8,581 | -7.3% | 2.7% |
| Pittsburgh, PA | 2,196 | 18.8% | 9.9% |
| Portland, OR | 2,993 | -9.4% | -15.6% |
| Riverside-San Bernardino, CA | 4,958 | -8.4% | 1.2% |
| Sacramento, CA | 2,621 | 4.1% | -10.6% |
| San Antonio, TX | 2,152 | -8.2% | -10.9% |
| San Diego, CA | 3,219 | -0.4% | -8.4% |
| San Francisco, CA | 1,169 | 0.6% | -3.1% |
| San Jose, CA | 1,342 | 4.7% | -12.0% |
| Seattle, WA | 3,757 | -3.8% | -7.1% |
| St. Louis, MO | 3,563 | 3.8% | 26.9% |
| Tampa, FL | 6,032 | 4.1% | 12.4% |
| Washington, DC | 7,932 | 1.9% | 14.2% |
| National | 239,800 | -1.6% | 1.2% |
All Homes for Sale
| Redfin Metro | All Homes for Sale | Month-Over-Month | Year-Over-Year |
|---|---|---|---|
| Atlanta, GA | 32,714 | 12.8% | -3.9% |
| Austin, TX | 6,856 | 6.0% | 12.4% |
| Baltimore, MD | 10,146 | 3.6% | -19.4% |
| Boston, MA | 10,608 | 8.7% | -23.7% |
| Charlotte, NC | 10,313 | 8.5% | -8.2% |
| Chicago, IL | 42,867 | 4.1% | -14.5% |
| Cincinnati, OH | 8,154 | 7.1% | -16.9% |
| Cleveland, OH | 8,558 | 1.8% | -18.9% |
| Columbus, OH | 6,568 | 8.3% | -13.0% |
| Dallas-Fort Worth, TX | 15,584 | -6.8% | -11.6% |
| Denver, CO | 5,462 | 3.5% | -8.0% |
| Detroit, MI | 10,055 | -2.1% | -28.1% |
| Edison, NJ | 13,267 | 3.4% | -14.5% |
| Fort Lauderdale, FL | 13,529 | -2.9% | -13.8% |
| Hampton Roads, VA | 7,564 | -0.7% | -13.5% |
| Houston, TX | 24,900 | 2.4% | 4.1% |
| Indianapolis, IN | 6,424 | -1.0% | -23.4% |
| Las Vegas, NV | 11,108 | -1.0% | -23.9% |
| Long Island, NY | 10,950 | 4.3% | -19.7% |
| Los Angeles, CA | 15,374 | -0.3% | -3.4% |
| Miami, FL | 17,620 | -3.3% | -5.2% |
| Milwaukee, WI | 6,238 | 5.7% | -13.7% |
| Minneapolis-St. Paul, MN | 10,861 | 6.3% | -14.6% |
| Nashville, TN | 8,908 | 4.0% | 6.3% |
| Oakland, CA | 2,754 | 13.8% | -12.3% |
| Orange County, CA | 7,108 | -0.1% | -8.4% |
| Orlando, FL | 9,538 | -3.7% | -23.7% |
| Philadelphia, PA | 14,873 | 5.4% | -18.8% |
| Phoenix, AZ | 21,557 | -5.2% | -15.4% |
| Pittsburgh, PA | 10,061 | 0.9% | -14.4% |
| Portland, OR | 4,544 | -1.8% | -9.9% |
| Riverside-San Bernardino, CA | 14,999 | -4.1% | -9.2% |
| Sacramento, CA | 4,020 | 3.6% | -26.1% |
| San Antonio, TX | 6,932 | -5.1% | -16.2% |
| San Diego, CA | 5,154 | -1.0% | -24.8% |
| San Francisco, CA | 1,989 | -0.1% | -12.8% |
| San Jose, CA | 1,542 | 2.7% | -28.5% |
| Seattle, WA | 3,324 | 4.0% | -35.3% |
| St. Louis, MO | 13,814 | 13.2% | -3.7% |
| Tampa, FL | 12,509 | -6.8% | -26.1% |
| Washington, DC | 16,588 | 4.8% | -20.5% |
| National | 734,800 | 1.7% | -13.3% |
New Listings
| Redfin Metro | New Listings | Month-Over-Month | Year-Over-Year |
|---|---|---|---|
| Atlanta, GA | 12,022 | -11.7% | -9.8% |
| Austin, TX | 4,045 | -3.6% | 4.1% |
| Baltimore, MD | 5,393 | -4.7% | -9.4% |
| Boston, MA | 8,240 | 2.6% | -9.7% |
| Charlotte, NC | 3,732 | -5.5% | -5.9% |
| Chicago, IL | 15,441 | -7.4% | -13.1% |
| Cincinnati, OH | 2,794 | -1.4% | -11.2% |
| Cleveland, OH | 3,297 | -1.8% | -6.5% |
| Columbus, OH | 3,258 | 5.0% | -5.0% |
| Dallas-Fort Worth, TX | 10,340 | -7.9% | -1.4% |
| Denver, CO | 5,989 | -3.6% | -2.9% |
| Detroit, MI | 6,682 | 1.3% | -14.8% |
| Edison, NJ | 4,486 | -4.6% | -11.5% |
| Fort Lauderdale, FL | 4,054 | -10.7% | -8.0% |
| Hampton Roads, VA | 2,668 | -12.8% | -8.4% |
| Houston, TX | 10,667 | -5.4% | 8.6% |
| Indianapolis, IN | 3,333 | -4.7% | -10.3% |
| Kansas City, MO | 4,004 | 0.0% | -13.2% |
| Las Vegas, NV | 4,079 | -11.9% | -8.6% |
| Long Island, NY | 3,884 | 1.6% | -5.3% |
| Los Angeles, CA | 8,266 | -7.4% | -7.1% |
| Miami, FL | 4,099 | -16.2% | -9.0% |
| Milwaukee, WI | 2,319 | -0.6% | -8.4% |
| Minneapolis-St. Paul, MN | 7,116 | -5.2% | -9.0% |
| Nashville, TN | 3,790 | -6.0% | -8.2% |
| Oakland, CA | 3,010 | 0.3% | -10.9% |
| Orange County, CA | 3,608 | -8.4% | -7.3% |
| Orlando, FL | 4,722 | -5.0% | -2.3% |
| Philadelphia, PA | 6,475 | -2.9% | -7.9% |
| Phoenix, AZ | 9,305 | -15.2% | -6.4% |
| Pittsburgh, PA | 2,853 | 3.1% | -7.9% |
| Portland, OR | 4,070 | 0.5% | -14.2% |
| Riverside-San Bernardino, CA | 6,305 | -6.9% | -7.7% |
| Sacramento, CA | 3,454 | -2.0% | -17.2% |
| San Antonio, TX | 3,174 | -6.9% | -5.3% |
| San Diego, CA | 3,839 | -10.3% | -13.2% |
| San Francisco, CA | 1,404 | -14.8% | -19.3% |
| San Jose, CA | 1,679 | -4.3% | -10.9% |
| Seattle, WA | 4,895 | -1.5% | -15.4% |
| St. Louis, MO | 4,809 | -8.9% | -14.9% |
| Tampa, FL | 6,206 | -11.6% | -2.5% |
| Washington, DC | 11,486 | -7.3% | -12.8% |
| National | 327,800 | -6.0% | -8.8% |


Comments
Post a Comment